A 1 App Builders
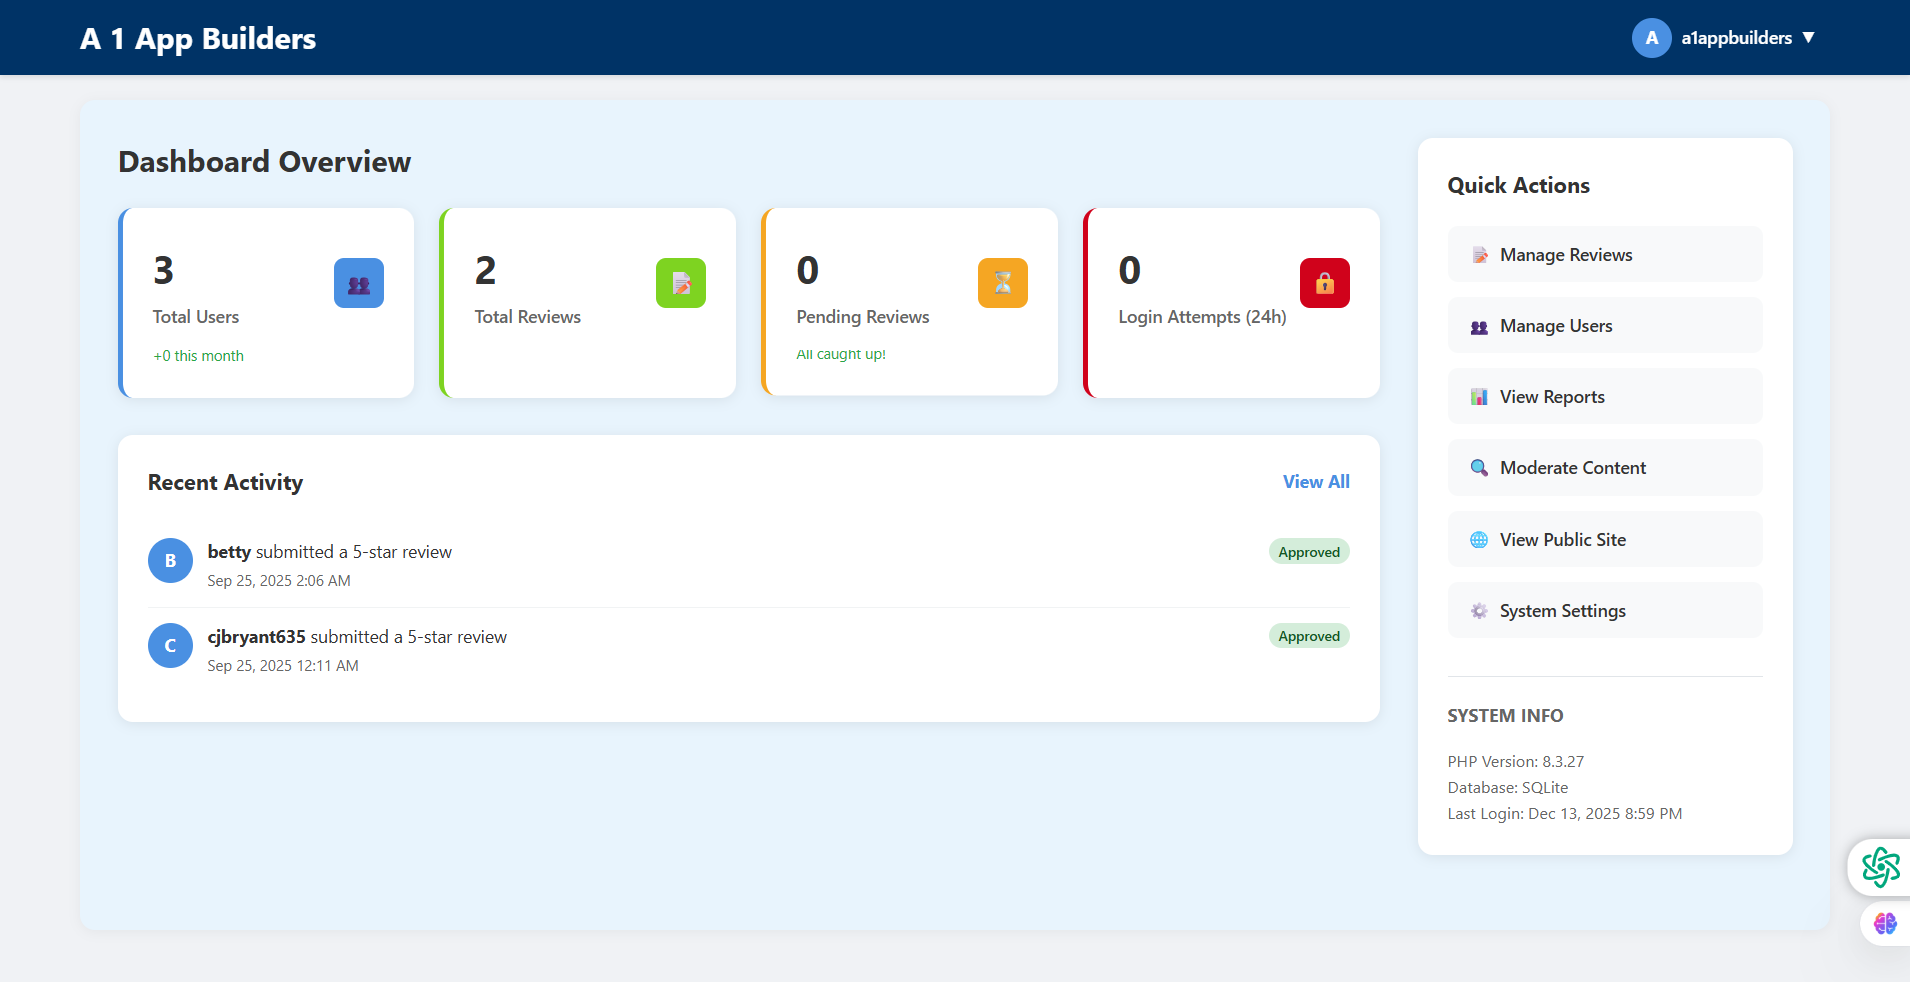
Welcome to the A1 App Builders Dashboard Overview—the central command center for monitoring system health, user activity, review statistics, and platform performance. This comprehensive administrative dashboard provides real-time visibility into key metrics through an organized card layout featuring user counts, review tallies, security monitoring, recent activity feeds, quick action shortcuts, and system information panels.
The interface prioritizes actionable intelligence with color-coded metric cards (blue, green, yellow, red), chronological activity timelines, instant-access navigation links, and persistent system status indicators that empower administrators to maintain platform oversight and respond quickly to user activities.
🌟 Key Features:
- Top Navigation Bar: Dark blue header displaying:
- "A 1 App Builders" logo in white text on left side
- User profile section on right with "A" avatar circle
- "a1appbuilders" username with dropdown arrow
- Consistent branding across admin interface
- Dashboard Overview Section: Main content area with heading and four metric cards in horizontal layout
- Total Users Card: Blue-bordered card featuring:
- Large "3" in bold display font
- "Total Users" label below number
- "+0 this month" growth indicator in green text
- Blue users icon in top-right corner
- Left border accent in blue
- Total Reviews Card: Green-bordered card showing:
- Large "2" metric display
- "Total Reviews" descriptive label
- Green document/clipboard icon in corner
- Left accent border in green
- Review count visibility at a glance
- Pending Reviews Card: Yellow-bordered card displaying:
- "0" in large numerals
- "Pending Reviews" status label
- "All caught up!" success message in green
- Yellow/orange warning icon in corner
- Left border in yellow/orange
- Login Attempts Card: Red-bordered security card with:
- "0" large metric number
- "Login Attempts (24h)" time-based label
- Red lock/security icon in top-right
- Left accent border in red
- 24-hour security monitoring window
- Recent Activity Section: Activity feed panel showing:
- "Recent Activity" heading with "View All" link
- Two activity entries with circular avatars
- "betty submitted a 5-star review" with timestamp "Sep 25, 2025 2:06 AM"
- Green "Approved" status badge
- "cjbryant635 submitted a 5-star review" with timestamp "Sep 25, 2025 12:11 AM"
- Green "Approved" status badge
- Chronological display of platform events
- Quick Actions Sidebar: Right-side panel featuring:
- "Quick Actions" section header
- Six navigation links with icons:
- "Manage Reviews" with document icon
- "Manage Users" with users icon
- "View Reports" with bar chart icon
- "Moderate Content" with magnifying glass icon
- "View Public Site" with globe icon
- "System Settings" with gear icon
- One-click access to key admin functions
- System Info Panel: Technical details section displaying:
- "SYSTEM INFO" heading
- PHP Version: 8.3.27
- Database: SQLite
- Last Login: Dec 13, 2025 8:59 PM
- Real-time system status visibility
- Floating Action Icons: Bottom-right corner utilities:
- Green settings/configuration icon
- Purple/pink brain/AI icon
- Persistent access to system tools
💡 Why It Works
This dashboard maximizes administrative efficiency through intelligent information architecture. The four-card metric layout provides instant system health visibility—blue for users, green for reviews, yellow for pending items, and red for security alerts. The "+0 this month" growth indicator adds temporal context to user metrics. The "All caught up!" message on pending reviews transforms zero from concerning to celebratory. The Recent Activity feed creates accountability and awareness by surfacing user actions chronologically with approval statuses. The Quick Actions sidebar eliminates navigation friction—administrators can jump to any major function in one click. The System Info panel provides technical transparency (PHP version, database type, last login) essential for troubleshooting. Color-coded borders create visual grouping while maintaining distinction. The "View All" link on Recent Activity suggests deeper data availability. This dashboard serves as both monitoring station and mission control, balancing overview metrics with actionable pathways to ensure administrators maintain system awareness while enabling rapid response to platform events.
Policy:
All upgrades are free.
This is a try-before-you-buy product; no refunds are issued after purchase.