A 1 App Builders
⚠️ Error Logs
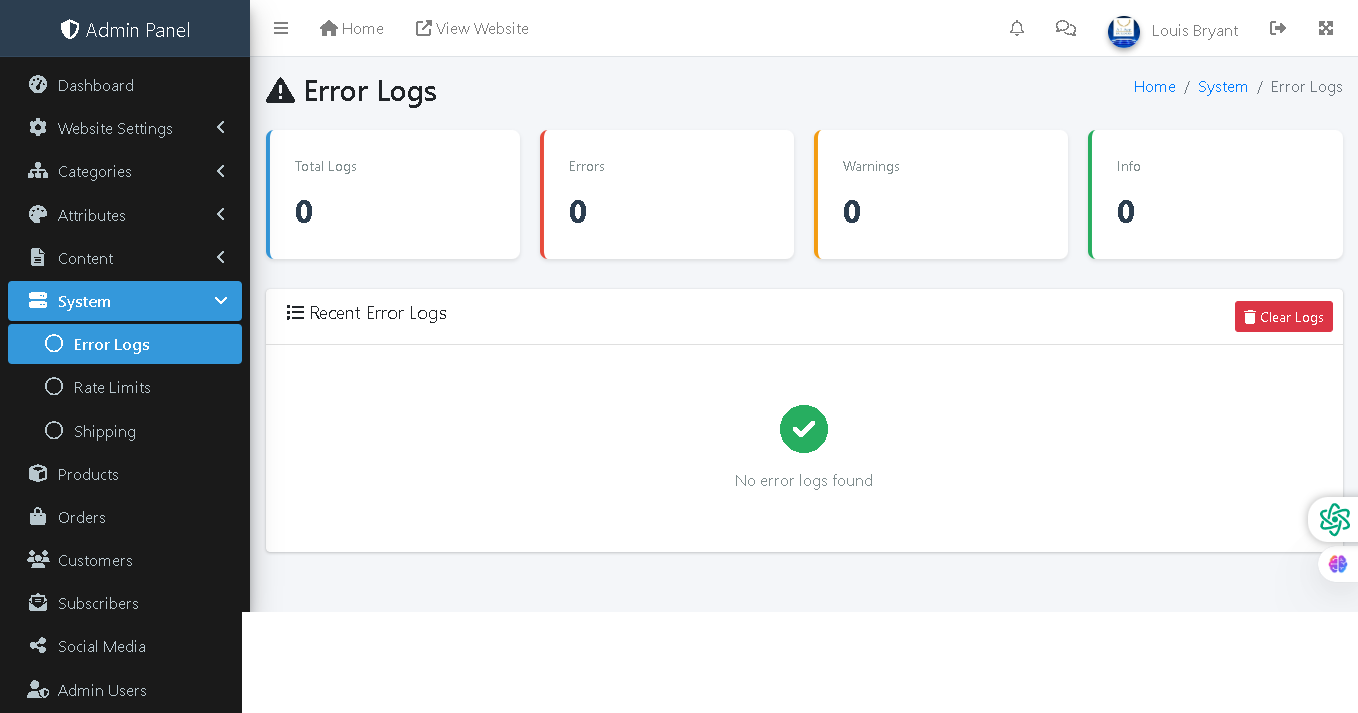
This admin panel page displays system error logs and diagnostics information. It tracks errors, warnings, and informational messages generated by the website to help administrators identify and troubleshoot technical issues, bugs, and system problems affecting site performance or functionality.
🔍 How It Works
- Log Summary Dashboard: Four metric cards display total counts for all categories of logs.
- Total Logs: Cumulative count of all logged events (errors, warnings, and info messages).
- Errors: Count of critical errors that may impact site functionality or user experience.
- Warnings: Count of non-critical warnings indicating potential issues or deprecated code usage.
- Info: Count of informational messages for general system events and audit trails.
- Recent Error Logs: Lists all logged events in chronological order with timestamps, severity levels, and descriptions.
- Clear Logs Button: Red button to purge all existing logs from the system for fresh monitoring.
- Empty State: Green checkmark and "No error logs found" message indicates the system is operating without issues.
🛠️ Troubleshooting
Administrators can use error logs to debug problems, identify patterns in failures, and track when issues occur. This is essential for maintaining system health and quickly resolving issues before they impact customers.
📊 Current Status
The system is currently healthy with zero total logs, zero errors, zero warnings, and zero info messages—indicating no problems detected.
Policy:
All upgrades are free.
This is a try-before-you-buy product; no refunds are issued after purchase.