A 1 App Builders
Welcome to the A 1 App Builders Visitor Tracking Program—a comprehensive analytics dashboard designed to monitor and analyze website traffic patterns. This administrative interface provides detailed insights into visitor behavior, browser usage, and site engagement metrics.
The interface features a clean, professional design with a light blue content area, organized left-side navigation menu, and data-driven reporting tools that help administrators understand their audience demographics and browsing habits.
🌟 Key Features:
- Left Sidebar Navigation: A comprehensive menu system provides quick access to all tracking modules:
- Visitors Heat Map
- Visitors Stats
- Visitors Log
- Visitors City Report
- Top Browsers Report (currently active)
- Referrers Report
- Top Pages Report
- Visitors Today Report
- IP Ban
- Logout option at the bottom
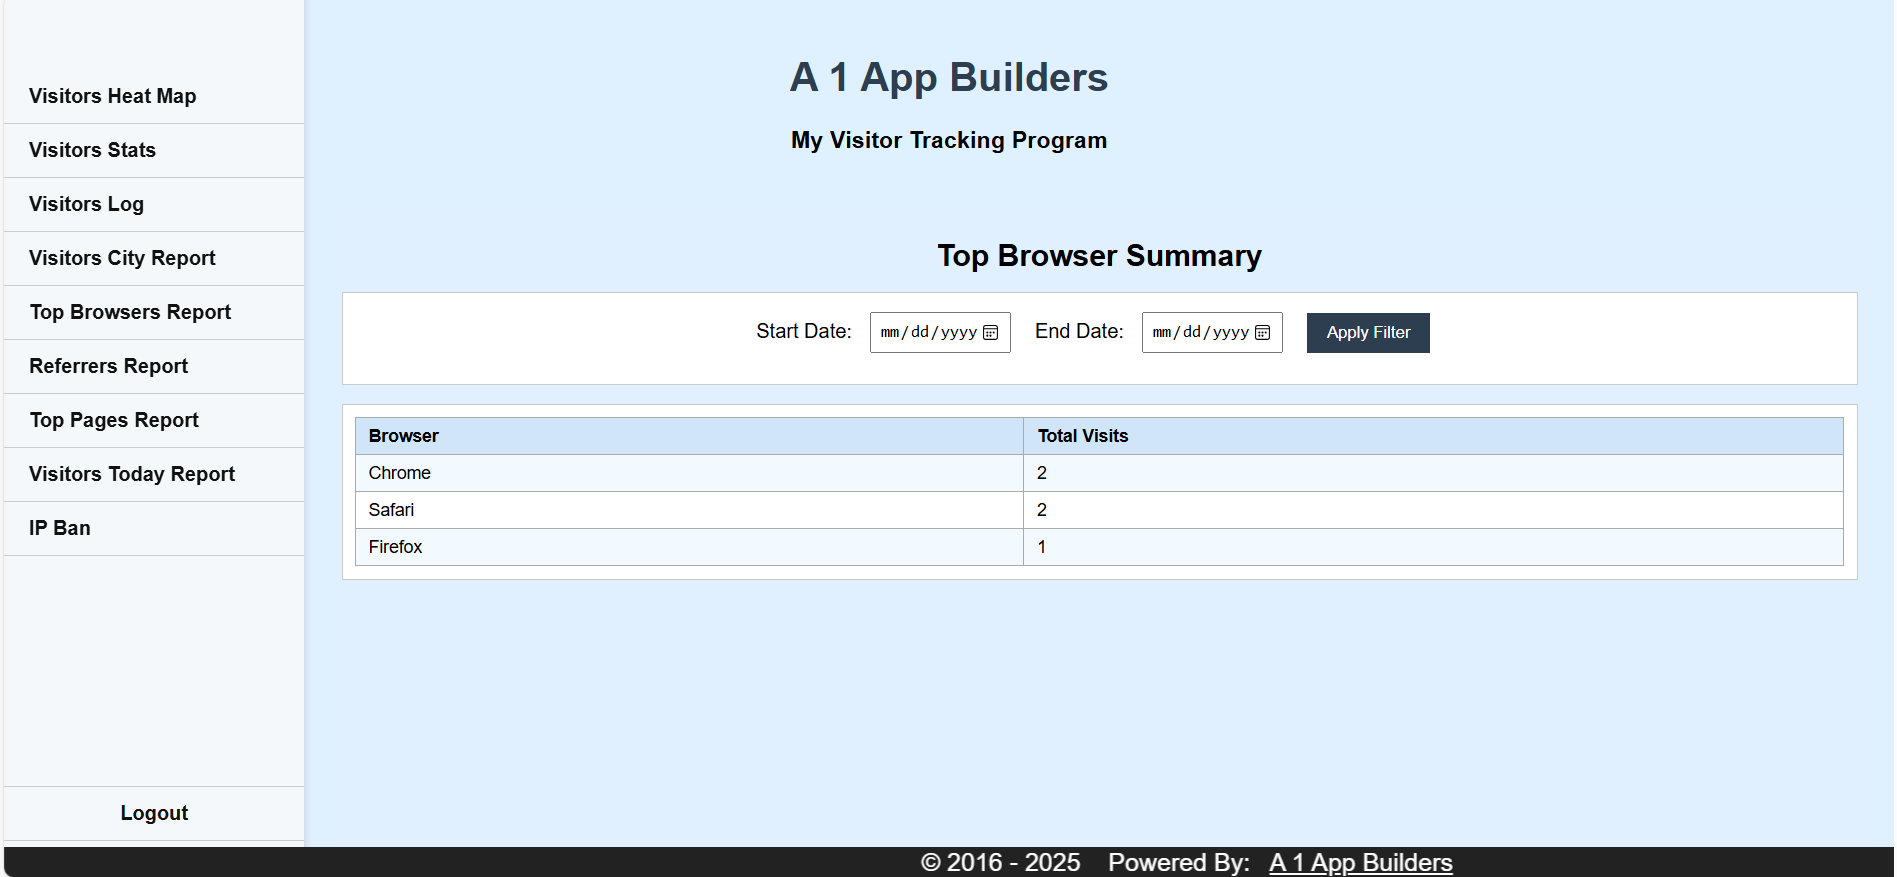
- Page Header: Clear branding displays "A 1 App Builders" title with "My Visitor Tracking Program" subtitle, establishing professional identity.
- Report Title: Bold "Top Browser Summary" heading clearly identifies the current analytics view.
- Date Range Filter: Flexible filtering system includes:
- Start Date picker with calendar icon (mm/dd/yyyy format)
- End Date picker with calendar icon
- Dark "Apply Filter" button for executing custom date queries
- Data Table Display: Clean, organized table structure showing:
- Browser Column: Lists browser names (Chrome, Safari, Firefox)
- Total Visits Column: Displays visit count for each browser
- Light blue header row for column labels
- White alternating rows for easy data scanning
- Current data shows: Chrome (2 visits), Safari (2 visits), Firefox (1 visit)
- Professional Footer: Copyright notice "© 2016 - 2025 Powered By: A 1 App Builders" in dark background establishes ownership and longevity.
- Responsive Layout: Two-column design with fixed left sidebar and flexible content area optimizes screen space usage.
- Color Scheme: Professional palette using white backgrounds, light blue accents, and dark navy navigation creates clear visual hierarchy.
💡 Why It Works
This analytics dashboard maximizes administrative efficiency through organized navigation, customizable date filtering, and clear data visualization. The browser usage report helps administrators understand their audience's technology preferences, enabling better optimization decisions for website compatibility and performance. The intuitive menu structure allows quick switching between different analytics views, while the date range filtering provides flexibility for comparing traffic patterns across different time periods. The clean table layout makes data interpretation immediate and actionable, supporting data-driven decision making for website improvements.
Policy:
All upgrades are free.
This is a try-before-you-buy product; no refunds are issued after purchase.